Daily incident report
Today we added new report which can be accessed by clicking “Reports” on left sidebar and then selecting “Incidents by date” tab:
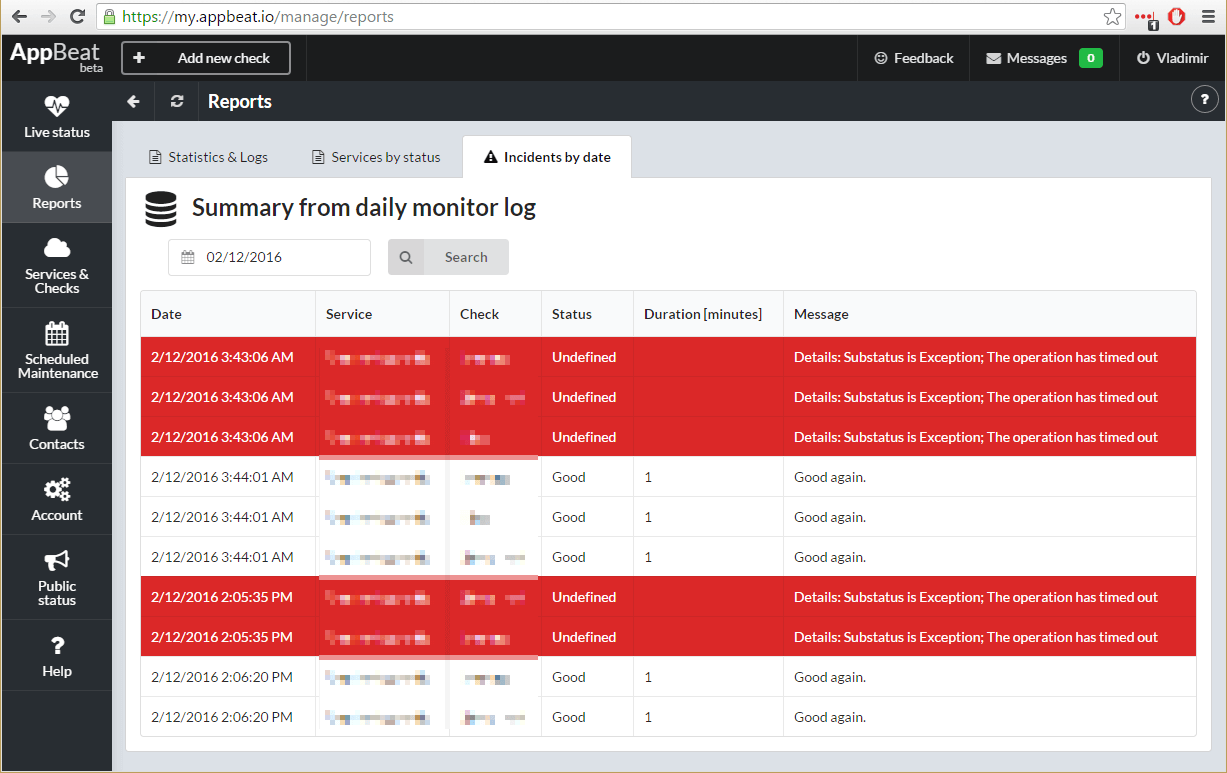
Here you can see for each problematic website or service when did problem start and how long it took until problem was resolved.
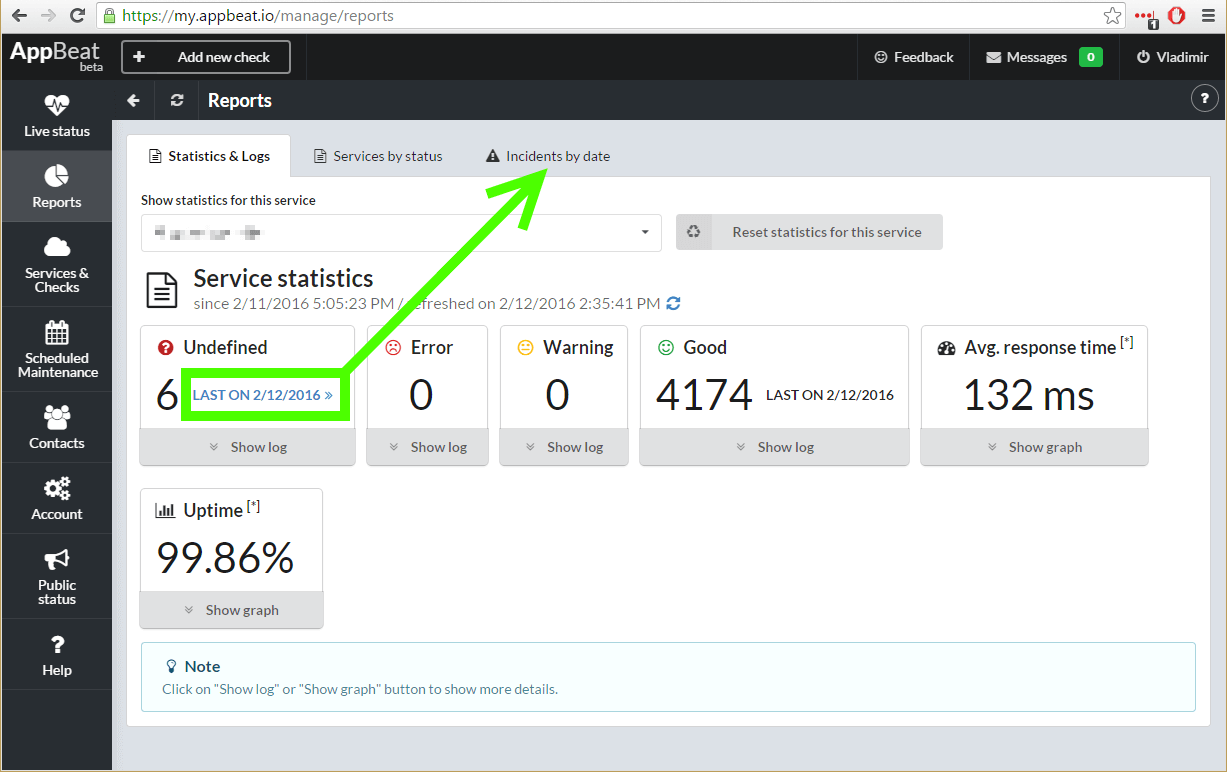
Alternatively you can also access this report by clicking date on “Undefined”, “Error” or “Warning” section of “Statistics & Logs” (as shown below in green rectangle):
Read other posts